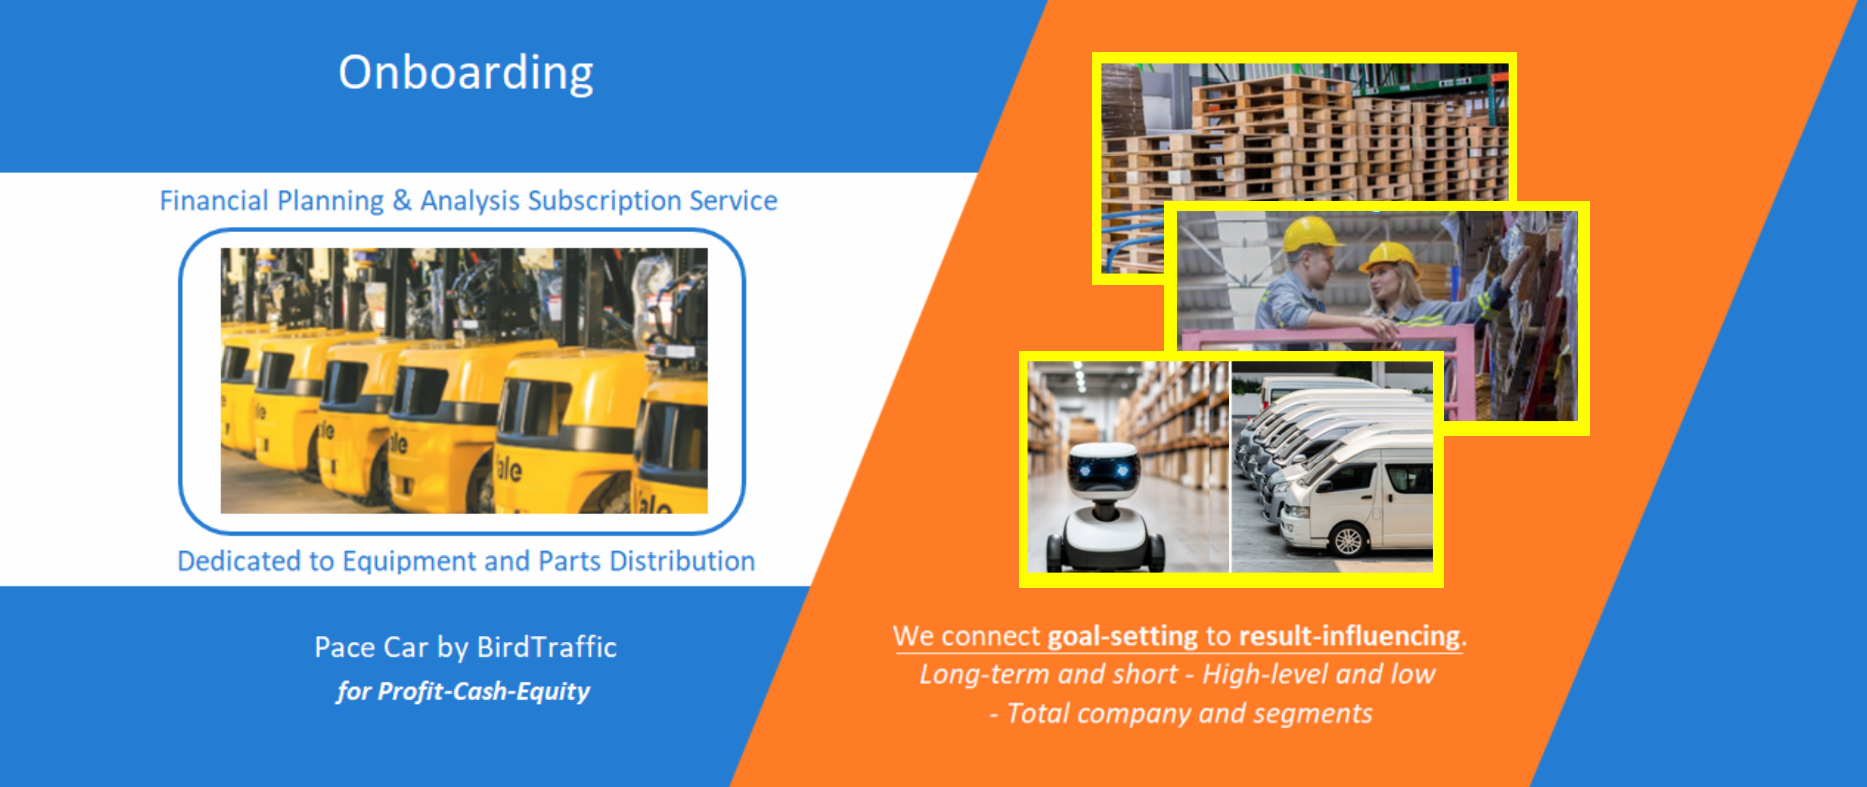
Onboarding to the Pace Car Subscription
Introduction
The strategy behind Pace Car is to run two parallel but connect processes. One is to manage in a Top Down fashion and the other is to manage in a Bottom Up way. The user can employ either approach or both at any given time.
The Top Down tool is called Path-Line. The Bottom Up tool is called Gap-Line. In both cases the reporting views present results over selected time periods. These periods can be historical or forward or both in any given view. The content of any view will be a set of results - a statement, a list, etc. on a selected topic.
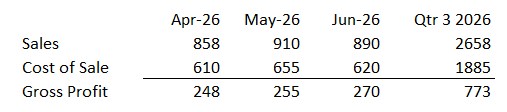
So you can imagine that view a have a set of dates going across and a set of results going down. The body of the view contains the calculated results. A simple approach performed over and over again for various purposes.
In any event, our process for preparing information for you begins with your submission of report copies or system downloads of data relevant to our current analysis.

Our onboarding sessions will walk you through the key elements of the subscription service. The steps appear in the map of the process below
The goal of the Onboarding is to get you with the process as quickly as possible. In the first month we will spend whatever time you want performing this orientation, though we do not expect it to take very long. There are two primary segments to cover, and they may take 1 to 1 ½ hours each.
Time Periods
The Top Down tool is called Path-Line. The Bottom Up tool is called Gap-Line. In both cases the reporting views present results over selected time periods. These periods can be historical or forward or both in any given view. The content of any view will be a set of results - a statement, a list, etc. on a selected topic.
So you can imagine that view a have a set of dates going across and a set of results going down. The body of the view contains the calculated results. A simple approach performed over and over again for various purposes.
A view can be as simple as the above snapshoot, or it could be up to 40 rows and 23 columns. The above is used often as part of a quick message in an email, a text or a Trello board. Full size reports serve to more formal purposes.
Selection of Results
A result can be almost anything - may or may not be in the trial balance or operating systems. May or may not be easy to assemble. So any planning & analysis task requires an assessment as to the availability and value of data.
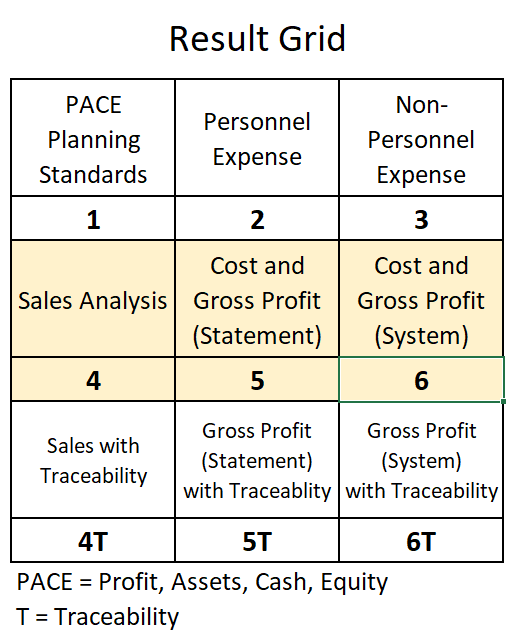
We use a Result Grid that is versatile enough to cover any expected task. There is a numbering system that guides the user to the information in the database, just like a general ledger.
As each cycle of use for Pace Car takes place, more data becomes available. New items are added regularly for new needs.
Here is the Result Grid. Our Orientation will walk you through it and various issues on making it work for you. Note that the largest attention of like items is devoted to Sales and Gross Profit results in recognition of the needs of the data patterns of wholesaler distributors. We will assist you with formatting downloaded information for us to use.
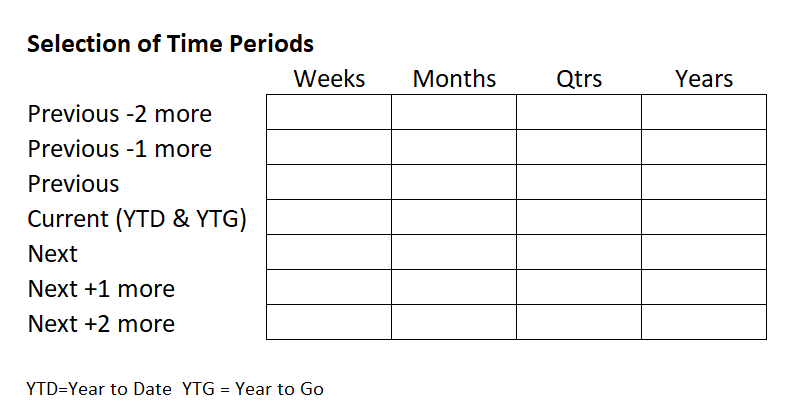
Selection of Time Periods
As with Results, we need to be able to handle a wide range of time periods, going back and going forward, a lot or a little, to perform analysis. We find that the further back or forward we are going, the less need for detail lines and periods there is. So the demands of these out periods are lower. However for certain assignments they are necessary nonetheless.
Also as with Results, we can assist you in some of the date breakdowns if they are not readily available. These types of things get discussed in planning tasks with you.
The chart below essentially show the universe of possibilities for selection of dates. As a matter of practice, the largest number of time periods we work with in either direction are bunched around the current date. But since we are in the business of uncovering cause and effect patterns, we sometimes want to cast a wider net.
What the Subscription Does
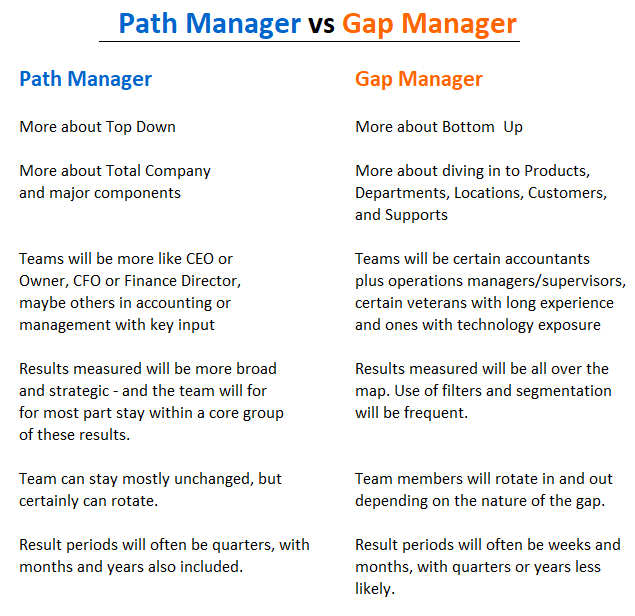
The above gives you some vocabulary related to the subscription’s operation. The concept of having both Top Down and Bottom Up tolls was introduced. From here, the Onboarding will go into the details on Path Manager - the Top Down tool, and Gap Manager, the Bottom Up tool.
Path Manager
Path Manager maintains projection lines for key scenarios. One is the “PACE Line:. This represents the practical best performance on the company, (Pace is Profit, Assets, Cash, Equity- a balance between this is anchor for the Line). We want to hit this because it is within practical reach. A second scenario is “Headed Here” which is the result line that our model says is an apparent future path.
The difference between PACE and Headed Here is a Gap which becomes a focus for the Bottom Up task.
Gap Manager
Having received Gap information, the Gap manager seeks explanations for the Gaps and suggest strategies for their resolution. This is a 1-2 punch called Sift-and-Solve. First we sift through results. Pace Car can do this in bulk. Then we suggest a starter set of strategies. The User is ultimately responsible for solutions, but Sift-and-Solve is dedesigned to be a running start for each issue.
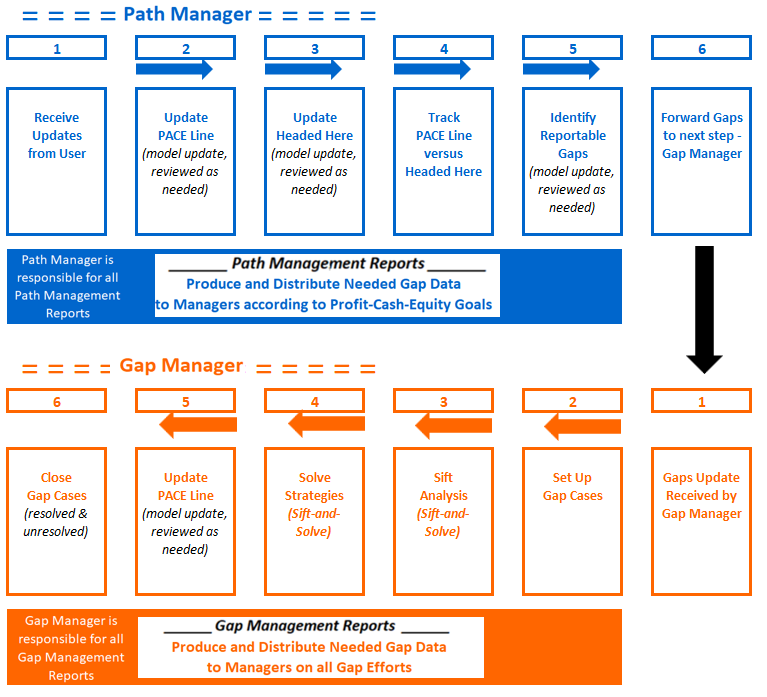
More on discussion of this process chart included in Monthly Rhythm.